What is the largest category on your current repair list?
Today's Homeowner found 82% of homeowners have at least one outstanding repair.
No votes yet. Yours will be the first. · saved on this device
Loading...
Home Repair Scopebook · Statistics
124 sourced data points on handyman services: what projects cost, what they return at resale, what homeowners choose, how many U.S. homes already have each feature by region, and 1 finding from Home Repair Scopebook's own analysis of federal household data. Every number links to where it came from.
These comparisons were calculated by Home Repair Scopebook from the Energy Information Administration's 2024 household survey microdata and the Census Bureau's new-housing tables. They answer questions the published reports don't break out.
Home Repair Scopebook analysis · 2024
95% interval 11.3%–13.3% · about 6.6 million homes · 7,124 survey households
95% interval 5.0%–6.6% · about 2.1 million homes · 4,841 survey households
Difference: 6.5 percentage points (95% interval 5.4 to 7.6).
Homes built before 1990 report frequent drafts about twice as often as newer ones. Air sealing is usually the cheapest first fix in an older house, before windows or new equipment.
Source: Home Repair Scopebook analysis of 2024 federal household survey data from the U.S. Energy Information Administration. How we calculated it
$406 national average handyman project cost across 103,764 verified projects (2026)
Angi's 2026 guide puts the typical range at $164 to $648 per visit. It is a project total for one or two tasks, not an hourly rate, so a longer bundled list will land above it.
Angi, How Much Does It Cost to Hire a Handyman? [2026 Data]10–30% typical markup when a handyman buys materials on your behalf
Angi reports handymen add 10% to 30% above retail on materials they source. Buying specified fixtures and products yourself avoids it; consumables like anchors and caulk are usually worth leaving to the pro.
Angi, How Much Does It Cost to Hire a Handyman? [2026 Data]$120–$350 Angi's 2026 price band for a drywall patch; faucet replacement $100–$300
Angi's per-task table gives single-job prices that include visit overhead. Inside a bundled visit each item costs less because the minimum and travel are spread across the list.
Angi, How Much Does It Cost to Hire a Handyman? [2026 Data]$300–$400 Angi's 2026 price band for TV mounting by a handyman
Angi's table places TV mounting at $300 to $400, above HomeAdvisor's $248 average, reflecting wall type, mount style, and cable concealment. Sending a photo of the wall narrows the quote.
Angi, How Much Does It Cost to Hire a Handyman? [2026 Data]$390 HomeAdvisor's 2026 national average handyman job cost ($165–$615 typical)
HomeAdvisor's figure lands within $20 of Angi's $406, which is a useful sign that both guides are describing the same one-or-two-task visit. Use either as a sanity check on a short list.
HomeAdvisor, 2026 Handyman Price List$60–$125 per hour HomeAdvisor's 2026 hourly handyman rate range, before materials
The spread maps to market and overhead: small markets and bare-bones operators at the low end, insured coastal-metro pros with stocked vans at the top. A quote outside this band deserves a question, not an assumption.
HomeAdvisor, 2026 Handyman Price List$65–$300 HomeAdvisor per-task installs: hall light $65 up to kitchen sink $300
The 2026 list also gives a bathroom faucet at about $90, a ceiling fan at $100, and a toilet or garbage disposal at $150. Dividing by an hourly rate gives a fair estimate of the time each task takes.
HomeAdvisor, 2026 Handyman Price List$65/hr the single most common handyman hourly rate, per Fixr
Fixr's 2025 guide finds $65 an hour is the mode, with emergency and after-hours calls at $90 to $200. It sits at the low-middle of HomeAdvisor's range and is a reasonable base for a planning calculator.
Fixr, How much does it cost to hire a handyman? (2025)$130 most common handyman minimum charge, per Fixr
The minimum is payable even if a job takes forty minutes. It is the strongest argument for bundling: one minimum spread across six tasks costs a fraction of six separate calls.
Fixr, How much does it cost to hire a handyman? (2025)$125–$800 Fixr repair bands: wall hole $125–$175, drywall repair $275–$800
Fixr also lists door, window, or fence repair at $125 to $200 and tile and grout at $200 to $400. These are standalone prices; inside a bundled visit the per-item cost falls.
Fixr, How much does it cost to hire a handyman? (2025)$75–$200 typical handyman minimum charge; material trip fees add $30–$80
HomeGuide notes minimums are often structured as a higher first-hour rate, and that a mid-job store run costs $30 to $80 plus mileage outside the service area. Buying specified parts in advance removes the trip.
HomeGuide, 2026 Handyman Hourly Rates and Price List$60–$75 per hour Thumbtack's national average handyman hourly rate
Thumbtack's marketplace data centers on $60 to $75 nationally, with a low end of $45 to $50 in small markets and $100 to $125 in expensive metros. The ends describe places, not better or worse pros.
Thumbtack, Handyman Hourly Rates and Price List (2026)$701–$1,105 Thumbtack's typical cost for a full-day handyman project
Thumbtack also reports simple tasks under two hours at $178 to $220 and multi-project half days of two to five hours at $316 to $428. Those bands work as fixed-price benchmarks for typical lists.
Thumbtack, Handyman Hourly Rates and Price List (2026)$50–$550 professional furniture assembly cost by piece size
HomeGuide bands run $50 to $150 for a small chair or bookshelf, $100 to $550 for a large dresser or desk, and $350 to $1,000 for extra-large wardrobes or bunk beds. IKEA add-on assembly runs $50 to $450.
HomeGuide, How Much Does It Cost to Assemble Furniture? (2025)$150–$400 labor-only cost to mount a TV (national average $275)
HomeGuide lists brick or masonry walls, above-fireplace placement, and in-wall wire concealment as the usual extras. The mount itself runs $15 to $500 and is not the place to save on a large screen.
HomeGuide, TV Mount Installation Cost (2025)$248 HomeAdvisor's average cost to have a TV professionally mounted
Most homeowners spend $150 to $347. Adding a power outlet behind the TV is about $210 and is electrician work in most areas, which is where a simple mount becomes a two-trade job.
HomeAdvisor, How Much Does It Cost to Mount a TV? (2026)$253 average cost to install a ceiling fan ($146–$360 typical)
A swap on existing wiring runs $100 to $300; needing new wiring pushes the job toward $2,000 and into licensed electrical work. A non-fan-rated ceiling box is the other common stop point.
HomeAdvisor, Cost to Install a Ceiling Fan (2026)$612 average drywall repair cost, with a $296–$929 typical range
HomeAdvisor prices small fixes at $20 to $120, ceilings at $220 to $1,300 and water-damaged sections at $600 to $1,550 because wet material has to come out and the cavity has to dry before anything goes back.
HomeAdvisor, How Much Does Drywall Repair Cost? (2026)$300–$500 contractor price to patch a small drywall hole, driven by $350–$650 minimums
HomeGuide's figure reflects drywall contractors' minimum job fees. A handyman with a $130 minimum, especially inside a bundled visit, patches the same hole under four inches for far less.
HomeGuide, How Much Does Drywall Repair Cost? (2025)$48–$80 installed cost per 4x8 drywall sheet ($1.50–$3.50 per sq ft)
Fixr's per-sheet price is the benchmark for new drywall in a room, where a contractor with a crew and a lift beats hourly handyman labor. A sheet or two to close a hole stays handyman work.
Fixr, Drywall Installation Cost (2025)$300–$1,000 cost to paint one room, walls only; $750 national average
HomeGuide's 2026 guide prices $1 to $3 per square foot of surface, $600 to $2,000 with ceiling and trim, and $150 to $300 in materials for DIY. Some painters carry a $250 to $500 minimum.
HomeGuide, How Much Does It Cost to Paint a Room? (2026)$908 HomeAdvisor's average cost to repair a wall of any material ($380–$1,437 typical)
This page covers plaster, concrete and structural damage as well as drywall, which is why it runs higher than HomeAdvisor's $612 drywall-only average. Plaster repairs alone run $500 to $1,000.
HomeAdvisor, How Much Does It Cost to Repair a Wall? (2026)$75–$125 per hour Housecall Pro's 2026 hourly band for corporate or franchise handymen
The same guide puts self-employed handymen at $50 to $80 an hour. Company rates reflect overhead, insurance and vetting; an experienced independent pro can charge as much.
Housecall Pro, Handyman Price Guide 2026$208–$452 Thumbtack's national price band for a handyman repair job
Thumbtack's by-job-type list runs from assembly at $187 to $365 up to flooring at $424 to $1,108, with installation at $193 to $397 and painting at $398 to $925.
Thumbtack, Handyman Hourly Rates and Price List (2026)$99–$179 one published price list's labor to mount a 51- to 65-inch TV, fixed to full-motion
ZOMG The Handyman's March 2026 list runs from $79 for a small TV on a fixed mount to $299 for a 76-inch-plus screen on a full-motion arm. The mount itself is usually extra.
ZOMG The Handyman, TV Mounting Cost Guide (2026)$365.4B U.S. handyman services industry revenue, 2026
IBISWorld's market sizing shows how large and fragmented small-repair spending is. There is no pricing standard across the industry, which is why homeowners have to compare written estimates carefully.
IBISWorld, Handyman Services in the US Market Size (2026)528,883 handyman service businesses in the U.S., 2026
Nearly all are small operators, many one person. With that many businesses and no shared standard, verifying insurance and reading estimates critically falls to the homeowner.
IBISWorld, Handyman Services in the US Number of Businesses (2026)$49,590 BLS median annual wage for general maintenance and repair workers
The median wage is the base a self-employed handyman's hourly rate has to cover before insurance, vehicle, tools, and unbilled time. It explains why $60 to $125 an hour is not excessive.
BLS Occupational Outlook Handbook, General Maintenance and Repair Workers (2025)4% projected growth in maintenance and repair employment, 2025–2035
BLS projects about 148,700 openings a year in the occupation. Demand is steady, so good pros stay booked one to three weeks out for non-urgent lists, longer in spring.
BLS Occupational Outlook Handbook, General Maintenance and Repair Workers (2025)$1,200 average annual maintenance spending per homeowner in 2023, a record
Harvard's Joint Center for Housing Studies reports owner maintenance spending up 61% since 2019 to $105 billion in aggregate. Two or three bundled handyman visits a year is a realistic way to spend that figure.
Harvard JCHS, Improving America's Housing 2025 (Key Facts)$2,041 average household spending on home maintenance in 2025
Angi's State of Home Spending report adds $1,143 in emergency repairs on top of routine maintenance. Scheduled bundled visits shrink the emergency line, which is the expensive one.
Angi, State of Home Spending Report (GlobeNewswire release) (2026)17.6% Homes described as poorly insulated (2024)
17.6% of occupied primary-residence housing units in 2024 (about 23.3M housing units); by region: Northeast 20.6%, Midwest 17.8%, South 15.6%, West 18.5%. Home Repair Scopebook's weighted analysis of EIA 2024 RECS preliminary household microdata (May 2026).
Home Repair Scopebook analysis of EIA 2024 RECS preliminary household microdata (May 2026)2.6% Homes described as uninsulated (2024)
2.6% of occupied primary-residence housing units in 2024 (about 3.4M housing units); by region: Northeast 2.9%, South 2.1%, West 3.5%. Home Repair Scopebook's weighted analysis of EIA 2024 RECS preliminary household microdata (May 2026).
Home Repair Scopebook analysis of EIA 2024 RECS preliminary household microdata (May 2026)41.3% Homes drafty some of the time (2024)
41.3% of occupied primary-residence housing units in 2024 (about 54.8M housing units); by region: Northeast 47.2%, Midwest 45.4%, South 37.8%, West 39.0%. Home Repair Scopebook's weighted analysis of EIA 2024 RECS preliminary household microdata (May 2026).
Home Repair Scopebook analysis of EIA 2024 RECS preliminary household microdata (May 2026)36.7% Homes using LED for all indoor bulbs (2024)
36.7% of occupied primary-residence housing units in 2024 (about 48.7M housing units); by region: Northeast 36.1%, Midwest 36.9%, South 36.3%, West 37.8%. Home Repair Scopebook's weighted analysis of EIA 2024 RECS preliminary household microdata (May 2026).
Home Repair Scopebook analysis of EIA 2024 RECS preliminary household microdata (May 2026)74.8% Homes using LED for at least half of indoor bulbs (2024)
74.8% of occupied primary-residence housing units in 2024 (about 99.1M housing units); by region: Northeast 73.7%, Midwest 76.5%, South 73.3%, West 76.5%. Home Repair Scopebook's weighted analysis of EIA 2024 RECS preliminary household microdata (May 2026).
Home Repair Scopebook analysis of EIA 2024 RECS preliminary household microdata (May 2026)8.6% Homes leaving incandescent or halogen outdoor bulbs on all night (2024)
8.6% of occupied primary-residence housing units in 2024 (about 11.3M housing units); by region: Northeast 7.2%, Midwest 7.4%, South 10.1%, West 8.0%. Home Repair Scopebook's weighted analysis of EIA 2024 RECS preliminary household microdata (May 2026).
Home Repair Scopebook analysis of EIA 2024 RECS preliminary household microdata (May 2026)84.1% share of owner improvement spending that went to professionals in 2023
JCHS calls this share unprecedented; DIY outlays fell in the same period. Homeowners are choosing to pay for skill and speed on small jobs as well as large ones.
Harvard JCHS, Improving America's Housing 2025 (Key Facts)29% of homeowners who hired a pro had bundled repairs into one visit to save money
Angi's April 2025 Home Spending Pulse surveyed homeowners who hired a pro in the prior year. Most were still paying visit overhead per task; bundling is the largest lever on a small-repair bill.
Angi 2025 Home Spending Pulse71% Prioritized preventative maintenance (April 15-16, 2025)
Angi's 2025 Home Spending Pulse surveyed homeowners who had hired a pro in the previous year (fielded April 15–16, 2025). 71% said they were putting preventive maintenance first.
Angi 2025 Home Spending Pulse62% of surveyed homeowners were more worried about maintenance affordability than a year earlier
Angi's 2025 pulse also found 19% chose cheaper materials or services and 23% started work early to beat price rises. A written list with fixed prices is the practical answer to that worry.
Angi 2025 Home Spending Pulse58% of DIYers spent more than planned because of mistakes
Hippo's survey of 1,736 homeowners also found 47% underestimated the time and 38% paid $500 or more to repair their own damage. The failures cluster in drywall finishing, painting, and electrical work.
Hippo, The Hidden Cost of DIY survey (2024)70% of homeowners cite saving money as their reason to DIY
Saving money is the motive for most DIY, yet 58% in the same Hippo survey overspent because of errors. The gap is the case for getting a quote on unfamiliar tasks before starting.
Hippo, The Hidden Cost of DIY survey (2024)83% of homeowners faced unexpected home repairs in 2024
Hippo's Housepower Report found the share nearly doubled from the prior year. Surprises are the normal case, so a written estimate should say what happens when one appears mid-visit.
Hippo, Housepower Report 2025 (PR Newswire release)82% of homeowners say at least one area of their home needs repair
Today's Homeowner's 2025 survey found 45% have one or two outstanding items and most intend to address them within six months. The households with four or more items gain the most from one bundled visit.
Today's Homeowner, Home Repair Survey (2025)21% of homeowners plan to finance repairs with a credit card
Today's Homeowner's survey also found 59% put repairs off because of cost. A bad hire is paid for twice, which is why reading estimates and reviews carefully is worth the time.
Today's Homeowner, Home Repair Survey (2025)9 in 10 renovating homeowners who hired a professional in 2024
The 2025 Houzz & Home study found 49% of renovators used specialty providers such as electricians and plumbers. Handymen and licensed trades coexist; the skill is routing each task to the right one.
Houzz, 2025 U.S. Houzz & Home Study47% of surveyed Houzz homeowners repaired something in 2025
The 2026 Houzz & Home study also found 54% renovated and 50% plan a renovation in 2026. It is a platform sample, not all U.S. households, but it shows how routine small repair work is.
2026 U.S. Houzz & Home Study6.5 pts Frequent-draft gap: pre-1990 vs 1990–2024 owner-occupied homes (2024)
Home Repair Scopebook's weighted analysis of the EIA's 2024 household survey microdata: Homes built before 1990 12.3% versus Homes built in 1990–2024 5.8% (a 6.5-point gap). An observed comfort problem provides a more useful research question than assuming all older homes need the same retrofit.
Home Repair Scopebook analysis of EIA 2024 RECS household data54% Renovated in 2025 (2025 activity; 2026 plans)
The 2026 U.S. Houzz & Home Study surveyed homeowners on Houzz about their 2025 projects and 2026 plans; 54% renovated in 2025 and 50% plan to renovate in 2026.
2026 U.S. Houzz & Home Study52% Decorated in 2025 (2025 activity; 2026 plans)
The 2026 U.S. Houzz & Home Study surveyed homeowners on Houzz about their 2025 projects and 2026 plans; 52% decorated in 2025, alongside 54% who renovated and 47% who made repairs.
2026 U.S. Houzz & Home Study50% of surveyed Houzz homeowners plan to renovate in 2026
The 2026 U.S. Houzz & Home Study found 54% of surveyed homeowners renovated in 2025 and 50% plan to renovate in 2026. Stated intent, from a Houzz platform sample.
2026 U.S. Houzz & Home Study19% Selected cheaper materials/services (April 15-16, 2025)
Angi's 2025 Home Spending Pulse surveyed homeowners who had hired a pro in the previous year (fielded April 15–16, 2025). 19% chose cheaper materials or services.
Angi 2025 Home Spending Pulse23% Started early before price rises (April 15-16, 2025)
Angi's 2025 Home Spending Pulse surveyed homeowners who had hired a pro in the previous year (fielded April 15–16, 2025). 23% started a project early before expected price rises.
Angi 2025 Home Spending Pulse$1,000 California's unlicensed handyman job limit (labor and materials) after AB 2622
AB 2622 raised the contractor-license exemption from $500 to $1,000 per project, provided no permit is required and no employees are used. Other states set their own thresholds and often license trades such as electrical and plumbing separately.
Contractors State License Board, Industry Bulletin #24-07 (Dec. 31, 2024)$40,000 project cost at which North Carolina requires a general contractor license
North Carolina raised the threshold from $30,000 to $40,000 on October 1, 2023. Electrical, plumbing and HVAC work is licensed by separate boards regardless of project size.
North Carolina Licensing Board for General Contractors (2026)$7,000 Utah's unlicensed repair and remodeling limit per project, labor and materials combined
Utah Code 58-55-305 exempts work under $7,000, but plumbing and electrical system work still needs a licensed contractor, and jobs over $3,000 require a filed affirmation of liability insurance.
Utah Code 58-55-305 (version effective May 7, 2025)50% of Realtors recommend a whole-home interior paint before listing
NAR's 2025 Remodeling Impact Report also found 41% recommend painting a single room. Both are handyman-scale jobs with fast turnaround, which is why they top pre-sale recommendations.
National Association of Realtors, 2025 Remodeling Impact Report press release13.8% of occupied U.S. homes are drafty most or all of the time (2024)
The EIA's 2024 Residential Energy Consumption Survey finds another 41.3% drafty some of the time. Weatherstripping, door sweeps, caulk, and attic hatch seals are afternoon tasks that bundle well.
EIA 2024 RECS preliminary household microdata (May 2026)17.2% of Northeast homes are drafty most or all of the time, the highest region (2024)
RECS 2024 shows 15.8% in the Midwest, 13.4% in the West, and 11.3% in the South. Northern repair lists lean toward weatherproofing; southern lists lean toward moisture and exterior caulk.
EIA 2024 RECS preliminary household microdata (May 2026)62.4% of U.S. homes still have mostly original windows (2024)
The share ranges from 47.6% in the Northeast to 71.5% in the South. Full replacement is contractor work; re-glazing, balances, storm panels, and frame sealing are handyman work and often what stops the draft.
EIA 2024 RECS preliminary household microdata (May 2026)33.1% of U.S. homes have mostly single-pane windows (2024)
RECS 2024 counts about 43.8 million homes with single-pane glass, from 28.8% in the Midwest to 37.4% in the South. Storm panels and weatherstripping are the handyman-scale fixes.
EIA 2024 RECS preliminary household microdata (May 2026)10.3% of U.S. homes use no indoor LED bulbs at all (2024)
RECS 2024 finds 36.7% of homes are all-LED and 74.8% at least half LED. Fixture and bulb upgrades are among the cheapest items to add to a handyman list once a pro is on site.
EIA 2024 RECS preliminary household microdata (May 2026)$1,000 California unlicensed handyman job limit after AB 2622
AB 2622 raised California's contractor-license exemption from $500 to $1,000 per project including labor and materials, provided no permit is needed and no employees are used. Jobs above state thresholds (commonly $500 to $2,500) require a licensed contractor.
Long Beach Property Management, AB-2622 exemption changes (2024)Homes drafty most or all of the time: 13.8% nationally. Highest in Massachusetts (20.8%), Kansas (19.8%), Oklahoma (19.2%); lowest in Florida (5.5%), Hawaii (6.6%), North Dakota (7.8%).
Homes with mostly original windows: 62.4% nationally. Highest in Mississippi (81.6%), Arizona (79.1%), Hawaii (78.3%); lowest in Massachusetts (44.7%), New York (46.1%), Ohio (47.4%).
Homes occupied by their owner: 67.6% nationally. Highest in Delaware (80.7%), West Virginia (79.7%), South Carolina (77.1%); lowest in District of Columbia (36.9%), New York (57.1%), California (58.2%).
Home Repair Scopebook calculated these state estimates from the Energy Information Administration's 2024 household survey microdata. EIA publishes the 2024 survey nationally and by region, not by state. Shares are weighted; a dash means the state sample was too small for a reliable estimate (fewer than 100 households, fewer than 10 yes answers, or a relative standard error above 30%). Source data.
| State | Homes drafty most or all of the time | Homes with mostly original windows | Homes occupied by their owner |
|---|---|---|---|
| United States | 13.8% | 62.4% | 67.6% |
| Alabama | 10.5% | 76.9% | 72.4% |
| Alaska | 10.3% | 73.7% | 70.9% |
| Arizona | 11.6% | 79.1% | 68.5% |
| Arkansas | 14.3% | 71.5% | 68.1% |
| California | 15.7% | 62.7% | 58.2% |
| Colorado | 10.1% | 67.7% | 68.3% |
| Connecticut | 16.7% | 48.5% | 68.7% |
| Delaware | — | 62% | 80.7% |
| District of Columbia | 15.3% | 57.4% | 36.9% |
| Florida | 5.5% | 72.7% | 71.1% |
| Georgia | 12.8% | 77.5% | 68% |
| Hawaii | 6.6% | 78.3% | 71.5% |
| Idaho | 10.7% | 71.8% | 73.2% |
| Illinois | 15.5% | 54% | 71.1% |
| Indiana | 15.6% | 55.3% | 74.6% |
| Iowa | 16.3% | 58.7% | 70.7% |
| Kansas | 19.8% | 59.9% | 70.8% |
| Kentucky | 11.8% | 60.6% | 73.5% |
| Louisiana | 9.5% | 71.5% | 69.7% |
| Maine | 12.1% | 51.5% | 76.6% |
| Maryland | 12.4% | 56.3% | 69.2% |
| Massachusetts | 20.8% | 44.7% | 61.2% |
| Michigan | 16.9% | 54% | 76.4% |
| Minnesota | 11.4% | 56.9% | 74.6% |
| Mississippi | 16% | 81.6% | 71.6% |
| Missouri | 17.3% | 58.1% | 70.9% |
| Montana | 11.5% | 62.4% | 69.2% |
| Nebraska | 13.8% | 54.8% | 68.4% |
| Nevada | 12% | 74.3% | 65.5% |
| New Hampshire | 16.5% | 47.8% | 73.5% |
| New Jersey | 18.3% | 51.8% | 59.7% |
| New Mexico | 10.4% | 69.9% | 72.6% |
| New York | 17.6% | 46.1% | 57.1% |
| North Carolina | 15.3% | 71.9% | 69.5% |
| North Dakota | 7.8% | 69.2% | 63.3% |
| Ohio | 16.7% | 47.4% | 69.9% |
| Oklahoma | 19.2% | 64.9% | 72.8% |
| Oregon | 13% | 60.4% | 70.1% |
| Pennsylvania | 15.7% | 47.9% | 70.3% |
| Rhode Island | 15.2% | 47.9% | 63.5% |
| South Carolina | 10.4% | 73.4% | 77.1% |
| South Dakota | — | 66.7% | 72.3% |
| Tennessee | 12.1% | 67% | 69.9% |
| Texas | 11% | 77.2% | 64.1% |
| Utah | 10.1% | 66.6% | 71.2% |
| Vermont | 8.5% | 49% | 72.8% |
| Virginia | 12.7% | 62.6% | 67.9% |
| Washington | 12.9% | 62.3% | 70.3% |
| West Virginia | 16.9% | 56.1% | 79.7% |
| Wisconsin | 17% | 51.1% | 67.3% |
| Wyoming | 11.4% | 60.9% | 76.2% |
How many existing homes already have the features that shape a handyman services project, nationally and in each census region. Home Repair Scopebook weighted these from the federal survey records; counts are rounded.
| Measure | U.S. | Northeast | Midwest | South | West | Source |
|---|---|---|---|---|---|---|
| Homes described as poorly insulated2024 · occupied primary-residence housing units | 17.6% | 20.6% | 17.7% | 15.6% | 18.5% | U.S. Energy Information Administration |
| Homes described as uninsulated2024 · occupied primary-residence housing units | 2.6% | 2.9% | — | 2.1% | 3.5% | U.S. Energy Information Administration |
| Homes drafty most or all of the time2024 · occupied primary-residence housing units | 13.8% | 17.2% | 15.8% | 11.3% | 13.4% | U.S. Energy Information Administration |
| Homes drafty some of the time2024 · occupied primary-residence housing units | 41.3% | 47.2% | 45.4% | 37.8% | 39.0% | U.S. Energy Information Administration |
| Homes with mostly single-pane windows2024 · occupied primary-residence housing units | 33.1% | 30.1% | 28.8% | 37.4% | 31.9% | U.S. Energy Information Administration |
| Homes with mostly original windows2024 · occupied primary-residence housing units | 62.4% | 47.6% | 54.2% | 71.5% | 66.0% | U.S. Energy Information Administration |
| Homes using LED for all indoor bulbs2024 · occupied primary-residence housing units | 36.7% | 36.1% | 36.9% | 36.3% | 37.8% | U.S. Energy Information Administration |
| Homes using no indoor LED bulbs2024 · occupied primary-residence housing units | 10.3% | 10.6% | 9.4% | 11.1% | 9.6% | U.S. Energy Information Administration |
| Homes using LED for at least half of indoor bulbs2024 · occupied primary-residence housing units | 74.8% | 73.7% | 76.5% | 73.3% | 76.5% | U.S. Energy Information Administration |
| Homes leaving incandescent or halogen outdoor bulbs on all night2024 · occupied primary-residence housing units | 8.6% | 7.2% | 7.4% | 10.1% | 8.0% | U.S. Energy Information Administration |
Published figures come from Angi, HomeAdvisor, Fixr, HomeGuide, Thumbtack, IBISWorld, BLS Occupational Outlook Handbook, Harvard JCHS and other named sources, each linked where it appears. Housing data by region is Home Repair Scopebook's weighted tabulation of the EIA's 2024 Residential Energy Consumption Survey public microdata, using the survey's own weights and 60 replicate weights for the intervals, and of the Census Bureau's Characteristics of New Housing tables. Figures describe the period and population shown next to each one.
Homeowner polls
Today's Homeowner found 82% of homeowners have at least one outstanding repair.
No votes yet. Yours will be the first. · saved on this device
No votes yet. Yours will be the first. · saved on this device
Hippo found 58% of DIYers spent more than planned because of mistakes.
No votes yet. Yours will be the first. · saved on this device
17.6% nationally in 2024 (about 23.3M housing units), based on Home Repair Scopebook's weighted analysis of EIA 2024 RECS preliminary household microdata (May 2026). The share is highest in the Northeast at 20.6% and lowest in the South at 15.6%. The figure covers occupied primary-residence housing units.
2.6% nationally in 2024 (about 3.4M housing units), based on Home Repair Scopebook's weighted analysis of EIA 2024 RECS preliminary household microdata (May 2026). The share is highest in the West at 3.5% and lowest in the South at 2.1%. The figure covers occupied primary-residence housing units.
13.8% nationally in 2024 (about 18.2M housing units), based on Home Repair Scopebook's weighted analysis of EIA 2024 RECS preliminary household microdata (May 2026). The share is highest in the Northeast at 17.2% and lowest in the South at 11.3%. The figure covers occupied primary-residence housing units.
41.3% nationally in 2024 (about 54.8M housing units), based on Home Repair Scopebook's weighted analysis of EIA 2024 RECS preliminary household microdata (May 2026). The share is highest in the Northeast at 47.2% and lowest in the South at 37.8%. The figure covers occupied primary-residence housing units.
33.1% nationally in 2024 (about 43.8M housing units), based on Home Repair Scopebook's weighted analysis of EIA 2024 RECS preliminary household microdata (May 2026). The share is highest in the South at 37.4% and lowest in the Midwest at 28.8%. The figure covers occupied primary-residence housing units.
Homes built before 1990 report frequent drafts about twice as often as newer ones. Air sealing is usually the cheapest first fix in an older house, before windows or new equipment. Home Repair Scopebook calculated this from the federal government's 2024 household survey data: owner-occupied homes built before 1990 12.3% versus owner-occupied homes built in 1990–2024 5.8%.
$406. Angi's 2026 guide puts the typical range at $164 to $648 per visit. It is a project total for one or two tasks, not an hourly rate, so a longer bundled list will land above it. Source: Angi, How Much Does It Cost to Hire a Handyman? [2026 Data].
10–30%. Angi reports handymen add 10% to 30% above retail on materials they source. Buying specified fixtures and products yourself avoids it; consumables like anchors and caulk are usually worth leaving to the pro. Source: Angi, How Much Does It Cost to Hire a Handyman? [2026 Data].
 Free toolHandyman cost calculator: price the visit by the hour
Size, material tier and complexity in, a realistic budget range out.
 Free toolWho should do the job? Handyman comparisons with sourced numbers
Side-by-side tables for the decisions that change the price most.
 Free toolHow well do you understand handyman pricing and scope?
10 questions that show what you already know and what to check next.
 Free toolPolls: how other homeowners handle the repair list
See what other planners chose and add your vote.
 Service guideGeneral Home Repairs
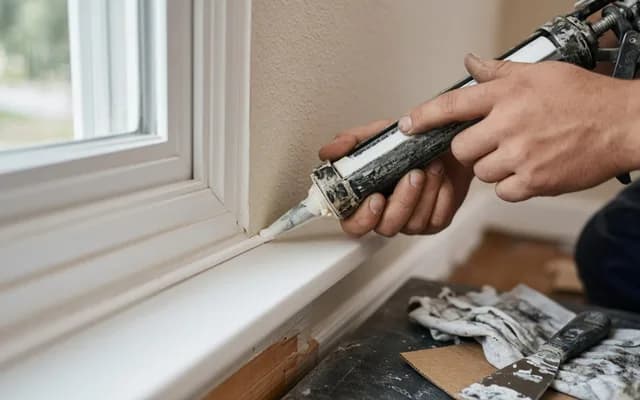
General home repairs are the grouped small tasks that keep a house working: sticking doors, loose handrails, failed caulk, cracked trim, wobbly fixtures, weatherstripping, and minor carpentry.
 Service guidePainting & Drywall
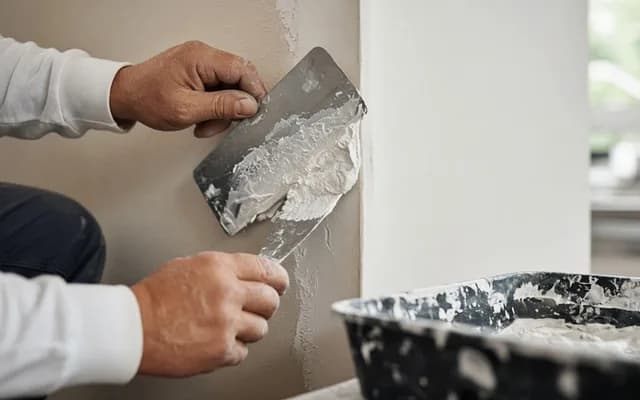
Painting and drywall work through a handyman covers holes, cracks, water-stained sections, corner bead damage, texture matching, and repainting a wall or room once the cause of the damage is handled.
 Service guidePlumbing & Electrical
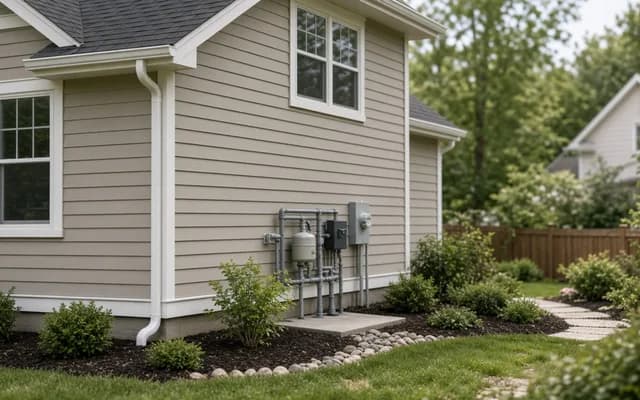
This scope covers minor plumbing and electrical symptoms a homeowner notices first: a dripping faucet, a running toilet, a slow drain, a dead outlet, a wobbling ceiling fan, a light fixture swap.
 Service guideFurniture Assembly & Mounting
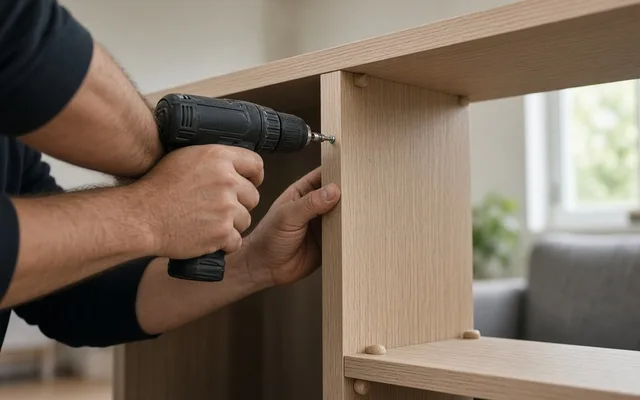
Assembly and mounting covers flat-pack furniture, TV and monitor mounts, floating shelves, mirrors, curtain hardware, and anti-tip anchoring for dressers and bookcases.
Tell us the size, the condition of what is there now, and what you want to change. Home Repair Scopebook passes your request to independent local professionals, who reply with written, no-obligation estimates. The service is free to use.